Welcome to the FlexRadio Community! Please review the new Community Rules and other important new Community information on the Message Board.
The latest SmartSDR Software:
SmartSDR v4.1.5 | SmartSDR v4.1.5 Release Notes
SmartSDR v3.10.15 | SmartSDR v3.10.15 Release Notes
The latest 4O3A Genius Product Software:
The latest 4O3A Genius Product Software and Firmware
SmartSDR v4.1.5 | SmartSDR v4.1.5 Release Notes
SmartSDR v3.10.15 | SmartSDR v3.10.15 Release Notes
The latest 4O3A Genius Product Software:
The latest 4O3A Genius Product Software and Firmware
How to Receive Technical Support::
If you are needing assistance with FlexRadio products, please refer to the product documentation or check the Help Center for known solutions. Need technical support from FlexRadio? It's as simple as creating a HelpDesk ticket.
If you are needing assistance with FlexRadio products, please refer to the product documentation or check the Help Center for known solutions. Need technical support from FlexRadio? It's as simple as creating a HelpDesk ticket.
PGXL chart

tw1
Member ✭✭
I am having a blast with my Flex Radio system. I have started digging into the PGXL menu and saw the Chart you can see whats going on. My first question is where is it stored on the computer.
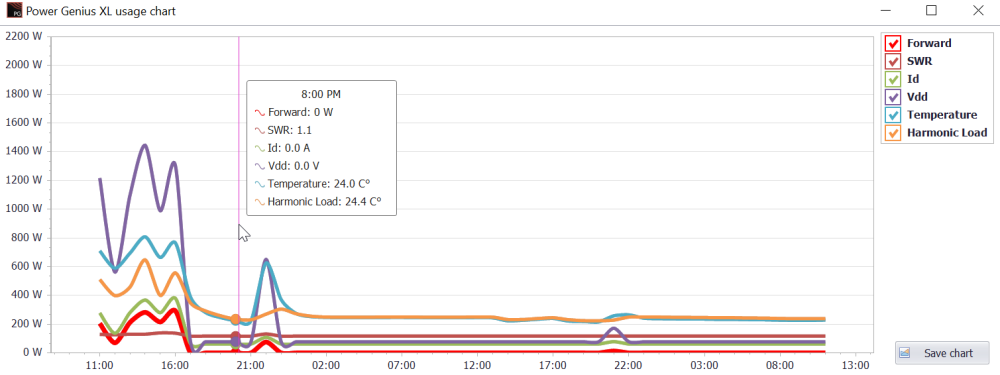
My second question is what exactly is this chart telling me? I looked up the 403A website and saw the same chart there but no real explanation. I would post a picture but I can not yet. If I understand it correctly the red line is power out ?
The purple line goes up high, and on the left side chart where is shows what I assume is the watts output. Should I be only concerned about the red line, purple?
I know this sounds like a dumb question, but I like to understand things like this.
Tagged:
0
Comments
-
Move your mouse around the graph and you can see what's happening around that time on the floating table.
Colors explained on te right side.
 0
0 -
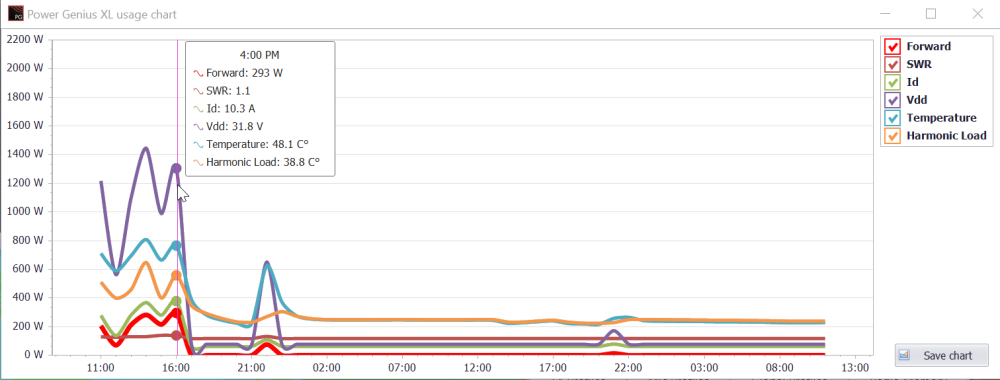
I see didn't notice that before. So in your first chart you have 0 watt output according to the RED line. On the bottom chart you have 293 watts out?
I have mine set to 500 watts out, and it shows this on the PGXL, TGXL, and SDR screen. but my chart shows 175 watts out if I hover over the line. Am I still not reading the chart right?0 -
I would post a pic of my chart but do not see where to attach it.0
-
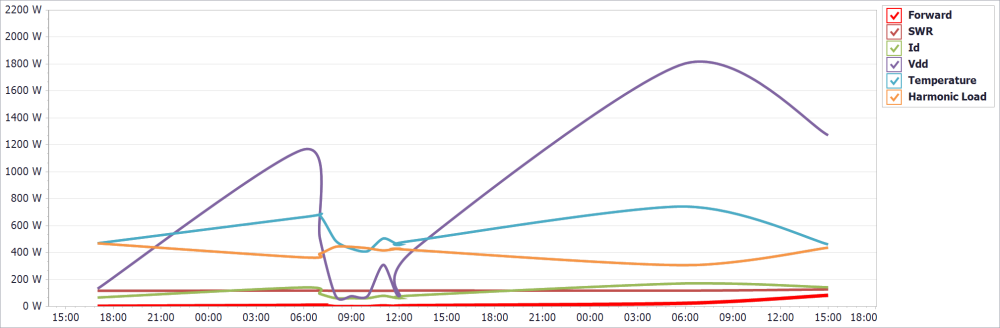
I got privileges to post a pic yea!
This is what my chart looks like from the PGXL software. The PGXL, TGXL, and my DL2K dummy load all say about 700 watts out in AM mode. According to this PGXL chart I am not putting any thing out.
I also installed FRSTACK3 and it shows about 700 watts out. AM, SSB, CW, all about the same. Is there anyone else see this or am I the only one? I have a call out to 403A to see what they think. Can you reset the PGXL or is this purely a software issue? I put in a ticket and they don't know, and told me to contact 403A.
0


Leave a Comment
Categories
- All Categories
- 388 Community Topics
- 2.2K New Ideas
- 658 The Flea Market
- 8.4K Software
- 156 SmartSDR+
- 6.5K SmartSDR for Windows
- 186 SmartSDR for Maestro and M models
- 439 SmartSDR for Mac
- 275 SmartSDR for iOS
- 265 SmartSDR CAT
- 204 DAX
- 386 SmartSDR API
- 9.4K Radios and Accessories
- 52 Aurora
- 297 FLEX-8000 Signature Series
- 7.2K FLEX-6000 Signature Series
- 970 Maestro
- 58 FlexControl
- 866 FLEX Series (Legacy) Radios
- 944 Genius Products
- 471 Power Genius XL Amplifier
- 347 Tuner Genius XL
- 126 Antenna Genius
- 306 Shack Infrastructure
- 215 Networking
- 468 Remote Operation (SmartLink)
- 142 Contesting
- 811 Peripherals & Station Integration
- 144 Amateur Radio Interests
- 1.1K Third-Party Software