SmartSDR v4.1.5 | SmartSDR v4.1.5 Release Notes
SmartSDR v3.10.15 | SmartSDR v3.10.15 Release Notes
The latest 4O3A Genius Product Software:
The latest 4O3A Genius Product Software and Firmware
If you are needing assistance with FlexRadio products, please refer to the product documentation or check the Help Center for known solutions. Need technical support from FlexRadio? It's as simple as creating a HelpDesk ticket.
FYI -Upcoming Frequency Measurement Event

BTW - in getting set up for this and dusting off and upgrading Fldigi, I came across a bug that was apparently caused by my NVIDIA drivers. When the screen saver kicked in it would sometimes cause an interruption in the audio which in turn caused Fldigi to freeze up and end the frequency analysis process. Normally do not use NVIDIA audio - must have allowed it to creep back in after a driver update.
73, Tom
K1FR
Comments
-
Just to clarify - I use DAX audio to drive Fldigi - the NVIDIA drivers are not directly involved. I do not understand the mechanism, but is clear that when the screen blanks under screen saver it creates the problem. Perhaps this is an indication that I have some corruption from an update. Need to look further.0
-
Tom K1FR,
I saw the posting in the December 2021 QST (page 76) and have been attempting to get Fldigi and my Flex 6600m set up properly for the HamSCI's December Antartic Exlipse Festival. I have an external GPSDO (BG7TBL 2020-10-25) feeding into a Q5 Signal splitter that goes to the 10 MHz in on the back of the 6600m and also feeds a ref signal to my 5BVUX transceiver. I made a test file (analysis_211119.csv) which I sent to Kristina Collins, KD8OXT, to see if I was getting a suitable file. She responded, "Hm, looks like the frequency plot is very noisy. Offhand, I am not sure what could be causing this. How does the audio sound? If you are using an SDR, you may find this library helpful: https://github.com/ccera-astro/wwv_doppler"
Since mid-November, I have been trying to see if I can lower my signal to noise ratio. Would you mind looking over the attached pics and give me an opinion of how this compares to what you are getting through your Flex and Fldigi setup?
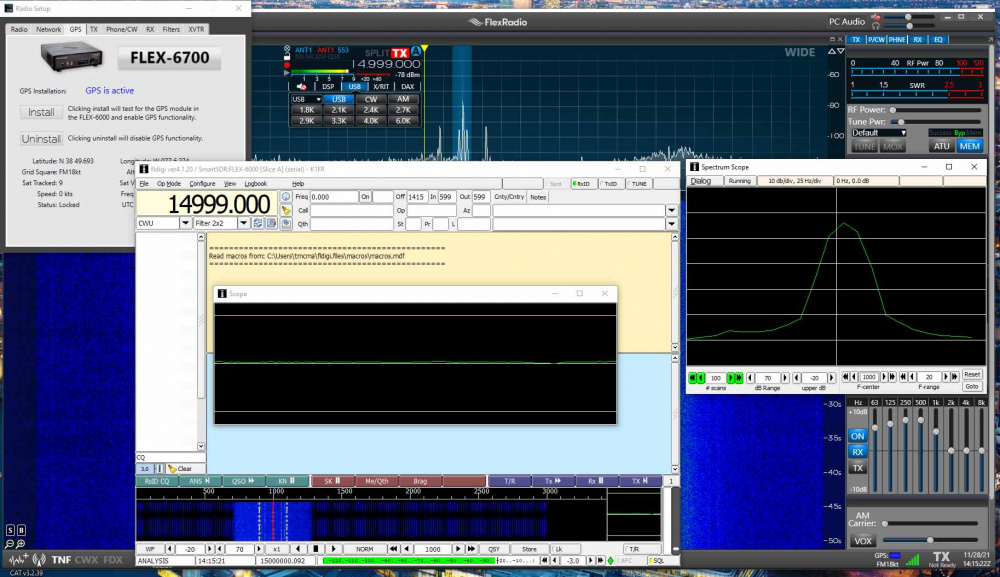
The bottom picture is the Flex display of the 10 MHz WWV but set as described by HamSCI with the 1000 Hz offset (9.999.000). I am using digu set at 1.5k. I believe this varies from HamSCI recommendation of using AM but I am assuming a digital setting will be proper for a sdr radio like the Flex 6600m. I have included my calibration of the RX display showing the TCXO locked from the GPSDO that was performed prior to starting Fldigi.
The top pic is of the Fldigi, ver 4.1.20 display with inserts of both the floating and spectrum display showing. I lowered the number of scans to 12, trying to get one scan every 5 seconds. My thought was that perhaps having 60 scans was adding to the what might be viewed as noise. I would be interested on what you have set for the number of scans.


Thanks in advance for your thoughts and suggestions, 73
Don AC0UH
0 -
Well, found one of the major problems I was experiencing. When I reviewed my Flex 6600m calibration - it was locking in on the TXCO and not the External GSPDO. I removed the Q5 Signal Splitter and fed the GSPDO directly into the 10MHz input on the back of the Flex 6600m and now my calibration locks into the External GSPDO. Included a new screen shot of the Flex RX calibration, fldigi, the two fldigi scopes. It definitely cleared up a lot of the variations in my frequency recordings.

Still open to suggestions or thoughts.
Don AC0UH
0 -
I will try to do similar set of screen shots tomorrow and get back to you. I am far from any kind of expert on this. Looks like you are on correct path though. 73, Tom K1FR
0 -
Don:
Please see the images below. The first is for WWV 15 MHz. I did not look at a long time period, but it is 0930 local, and the doppler looks fairly steady. The ionosphere's normal big morning shift is past.
The second image is for a local AM station which I have found to have super stable frequency control (I am guessing they have a GPSDO in their system). That takes all the propagation induced doppler out of the picture. As you can see, the frequency variation is gone. Looking at the fldigi .CSV files shows it to be within just a few milliHertz.
If you have a similar AM station nearby, that will give you a better picture of your system's performance.
Also, if you have not already seen it - there is some good info on the Flex site about FMT with specifics on improving the reported frequency accuracy. A link: https://www.flexradio.com/documentation/arrl-fmt-technique-with-flex-6000-series-radios/
Good luck with Kristina's latest experiment. I plan to give it a go as well.'
73, Tom K1FR
 0
0 -
Tom, K1FR,
Thanks for the comments - the village of Orion, IL where I live is on a high area for the area so there are multiple TV and radio stations in the immediate area. I will check them out to see if one of them is using GPSDO. As you state this would provide a local source without any doppler impact due to the close proximity location. I noticed in some of the discussion in some of the HamSCI sites that N6GN provides this close proximity site for WWV near Boulder, CO on 10MHz. Some of his recordings from Nov. 15th are in this link: https://zenodo.org/record/5715673.
I just turned in my data for day 9 of the collection. I have looked at the data file it creates but haven't been able to chart or graph it using Microsoft Excel - too much data for the spreadsheet to handle. Thus, I don't know how to deal with graphing or charting two collections of data at the same time to compare - say one collected on a distant beacon and another that is close and stable enough to provide a comparison that negates the doppler effect in the ionosphere. Regardless, it is interesting and has helped me get my external GSPDO working properly. Thanks for pointing out the Flex site about FMT accuracy - will check it out.
73, Don, AC0UH
0


Leave a Comment
Categories
- All Categories
- 388 Community Topics
- 2.2K New Ideas
- 658 The Flea Market
- 8.4K Software
- 156 SmartSDR+
- 6.5K SmartSDR for Windows
- 186 SmartSDR for Maestro and M models
- 439 SmartSDR for Mac
- 275 SmartSDR for iOS
- 265 SmartSDR CAT
- 204 DAX
- 386 SmartSDR API
- 9.4K Radios and Accessories
- 53 Aurora
- 297 FLEX-8000 Signature Series
- 7.2K FLEX-6000 Signature Series
- 970 Maestro
- 58 FlexControl
- 866 FLEX Series (Legacy) Radios
- 944 Genius Products
- 471 Power Genius XL Amplifier
- 347 Tuner Genius XL
- 126 Antenna Genius
- 306 Shack Infrastructure
- 215 Networking
- 468 Remote Operation (SmartLink)
- 142 Contesting
- 811 Peripherals & Station Integration
- 144 Amateur Radio Interests
- 1.1K Third-Party Software